Measuring Thoroughbred Success, one Horse at a Time
The biomechanical analysis done by Cecil Seaman & Co., LLC is derived by taking a number of precise measurements on a horse and scientifically comparing them to all the 114,000+ horses in the master database This analysis consists of an overall grade summarizing the horse’s racing ability.
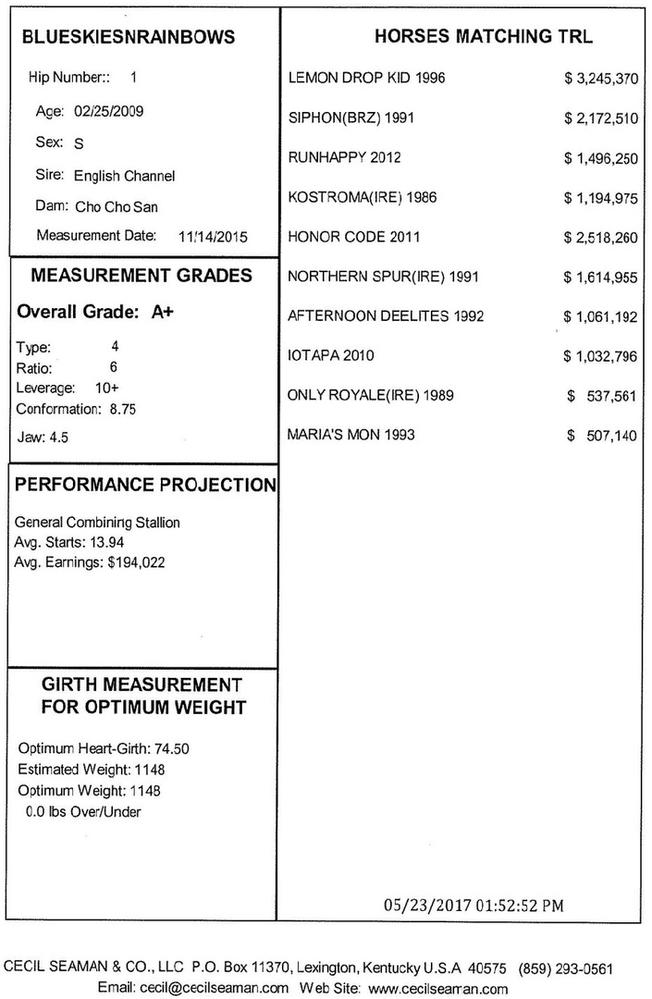
Measurement Grades: Includes the Overall Grade, Type, Ratio, Leverage, and Conformation Score. There are over 1600 possible TRL combinations.
Grade Report Explanation
Measurement Grades: Includes the Overall Grade, Type, Ratio, Leverage, and Conformation Score.
There are over 1600 possible TRL combinations.
- Overall Grade: Ranges from A+ to C and is based on the race records of all Thoroughbreds in our database.
Grade Report Explanation
Measurement Grades: Includes the Overall Grade, Type, Ratio, Leverage, and Conformation Score.
There are over 1600 possible TRL combinations.
- Overall Grade: Ranges from A+ to C and is based on the race records of all Thoroughbreds in our database.
| Grade | GSW% | Avg Earnings |
|---|---|---|
| A+ | 10%+ | $145,000 |
| A | 9.9%-8% | $110,000 |
| A- | 7.9%-5% | $93,000 |
| B+ | *4.9%-2% | $81,000 |
| B | 1.9%-.1% | $62,000 |
| B- | >.1% | $50,000 |
| C | 0% | %34,000 |
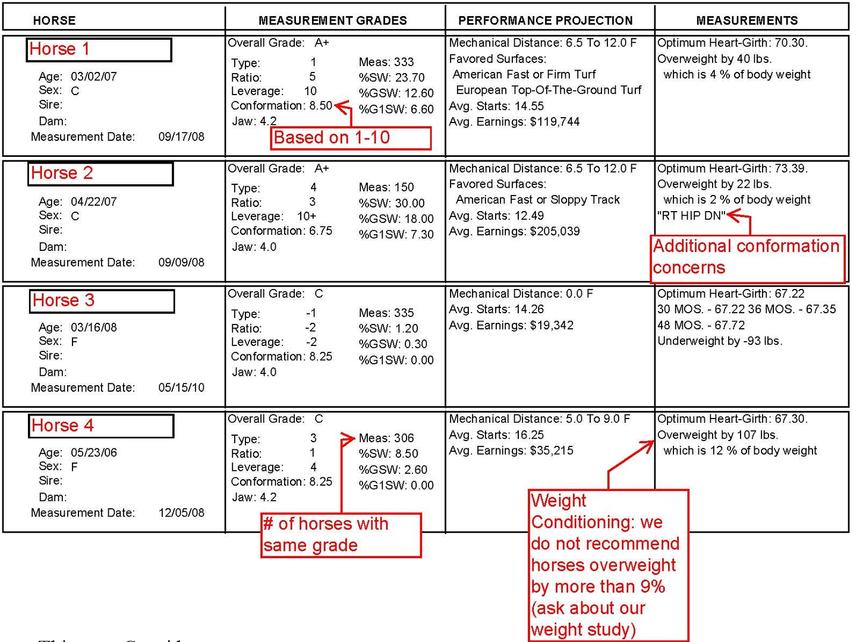
- Type: (-1 to 10) Refers to the horse’s soundness and balance. A lower type score implies better soundness and the greater number of lifetime starts the horse should be able to make.
- Ratio: (-5 to 9) the leverage times the mass of the horse. The ratio helps determine the horse’s efficiency.
- Leverage: (-5 to10$) the ability to produce the power necessary to run competitively. The higher the number, the more powerful the horse. This is the most important component of the score, as without adequate power the horse will not be able to compete at the high levels desired.
- Conformation: An overall score on conformation faults; ranges from 1 to 10, with 10 being perfect.
- Jaw: Represents the number of fingers that fit between the jaw bones of the horse.
- Meas: The number of horses in our database with the same TRL.
- %SW, %GSW, %G1W: The percentage of horses within that particular TRL that are stakes winners, graded stakes winners and grade 1 stakes winners.
Performance Projections:
- Mechanical Distance: The optimum projected distance the horse is suited to run.
- Favored Surfaces: The projected racing surface for the horse.
- Average Starts: The average number of starts of horses with the same TRL.
- Average Earnings: Based on the race records of all horses in our database with the same TRL; the average of the actual earnings.
Measurements:
- Optimum Heart-Girth: A tool for managing the weight of the horse.
- Overweight/Underweight: Estimation in pounds that the horse is over or underweight. Also gives the estimation in % of body weight.
Click Here to Read More About the Definition of Biomechanics and the Database
There are many agents in the industry that can select a horse for you. But no matter how astute or experienced they are, their visual analysis cannot equal the information gained by physically measuring and scientifically evaluating a horse. Forty years of experience, a unique database and a phenomenal track record are at your disposal. Let Cecil Seaman & Co. measure your success, one horse at a time.


